


Prevalence of Health Care Coverage Among Delaware Adults, 2022
Access to quality health care is vital for everyone to achieve and maintain good health. Tracking and analyzing health care coverage data is an essential tool that facilitates state-level support where needed. The Delaware Behavioral Risk Factor Survey (BRFS) includes a set of questions about health care and health insurance among Delaware adults.
One of the findings from the 2022 BRFS was that – even with the expanded coverage of the Affordable Care Act (ACA) – 36.2 percent of Latino/Hispanic residents between the ages of 18 and 64 do not have any form of health care coverage or health insurance.
Overall in 2022, 8.7 percent of Delaware adults age 18-64 reported not having health insurance. That means that about 48,228 Delaware adults did not have health insurance during 2022. Results of some survey questions about health insurance are presented for “adults ages 18-64” rather than “all adults” because anyone 65 or older should be covered by Medicare.
| Race/Ethnicity | Total Population | Non-Hispanic White | Black/African American | Hispanic/Latino |
|---|---|---|---|---|
| Adults 18-64 |
8.7% (CI=7.1-10.3%) |
5.5% (CI=3.7-7.3%) |
—–% (—–) |
36.2% (CI=28.9-43.5%) |
—–Cannot be reported due to small cell size.
Source: Delaware Health & Social Services, Division of Public Health, Behavioral Risk Factor Survey (BRFS), 2022.
There were no major differences in uninsured, with 8.7 percent of males compared to 8.6 percent of Delaware adults females reporting that they do not have some form of insurance. While differences by age group were not statistically significant, adults under age 45 had slightly higher prevalence of being uninsured.
Educational level was a major predictor of whether someone had health insurance. Delaware adults with a college degree were consistently more likely to have some form of health insurance than adults with less than a high school education. While 32.6 percent of adults with less than a high school education had no health insurance, that prevalence dropped to 8.2 percent of adults ages 18-64 with at least some college education.
The 2013 BRFS – the last survey prior to the implementation of the major components of the Affordable Care Act (ACA) – reported the prevalence of “no health insurance” in Delaware at 14.3 percent (with a confidence interval of 12.7 to 15.9 percent). The graph below shows the prevalence of health care coverage by year for the past ten years:
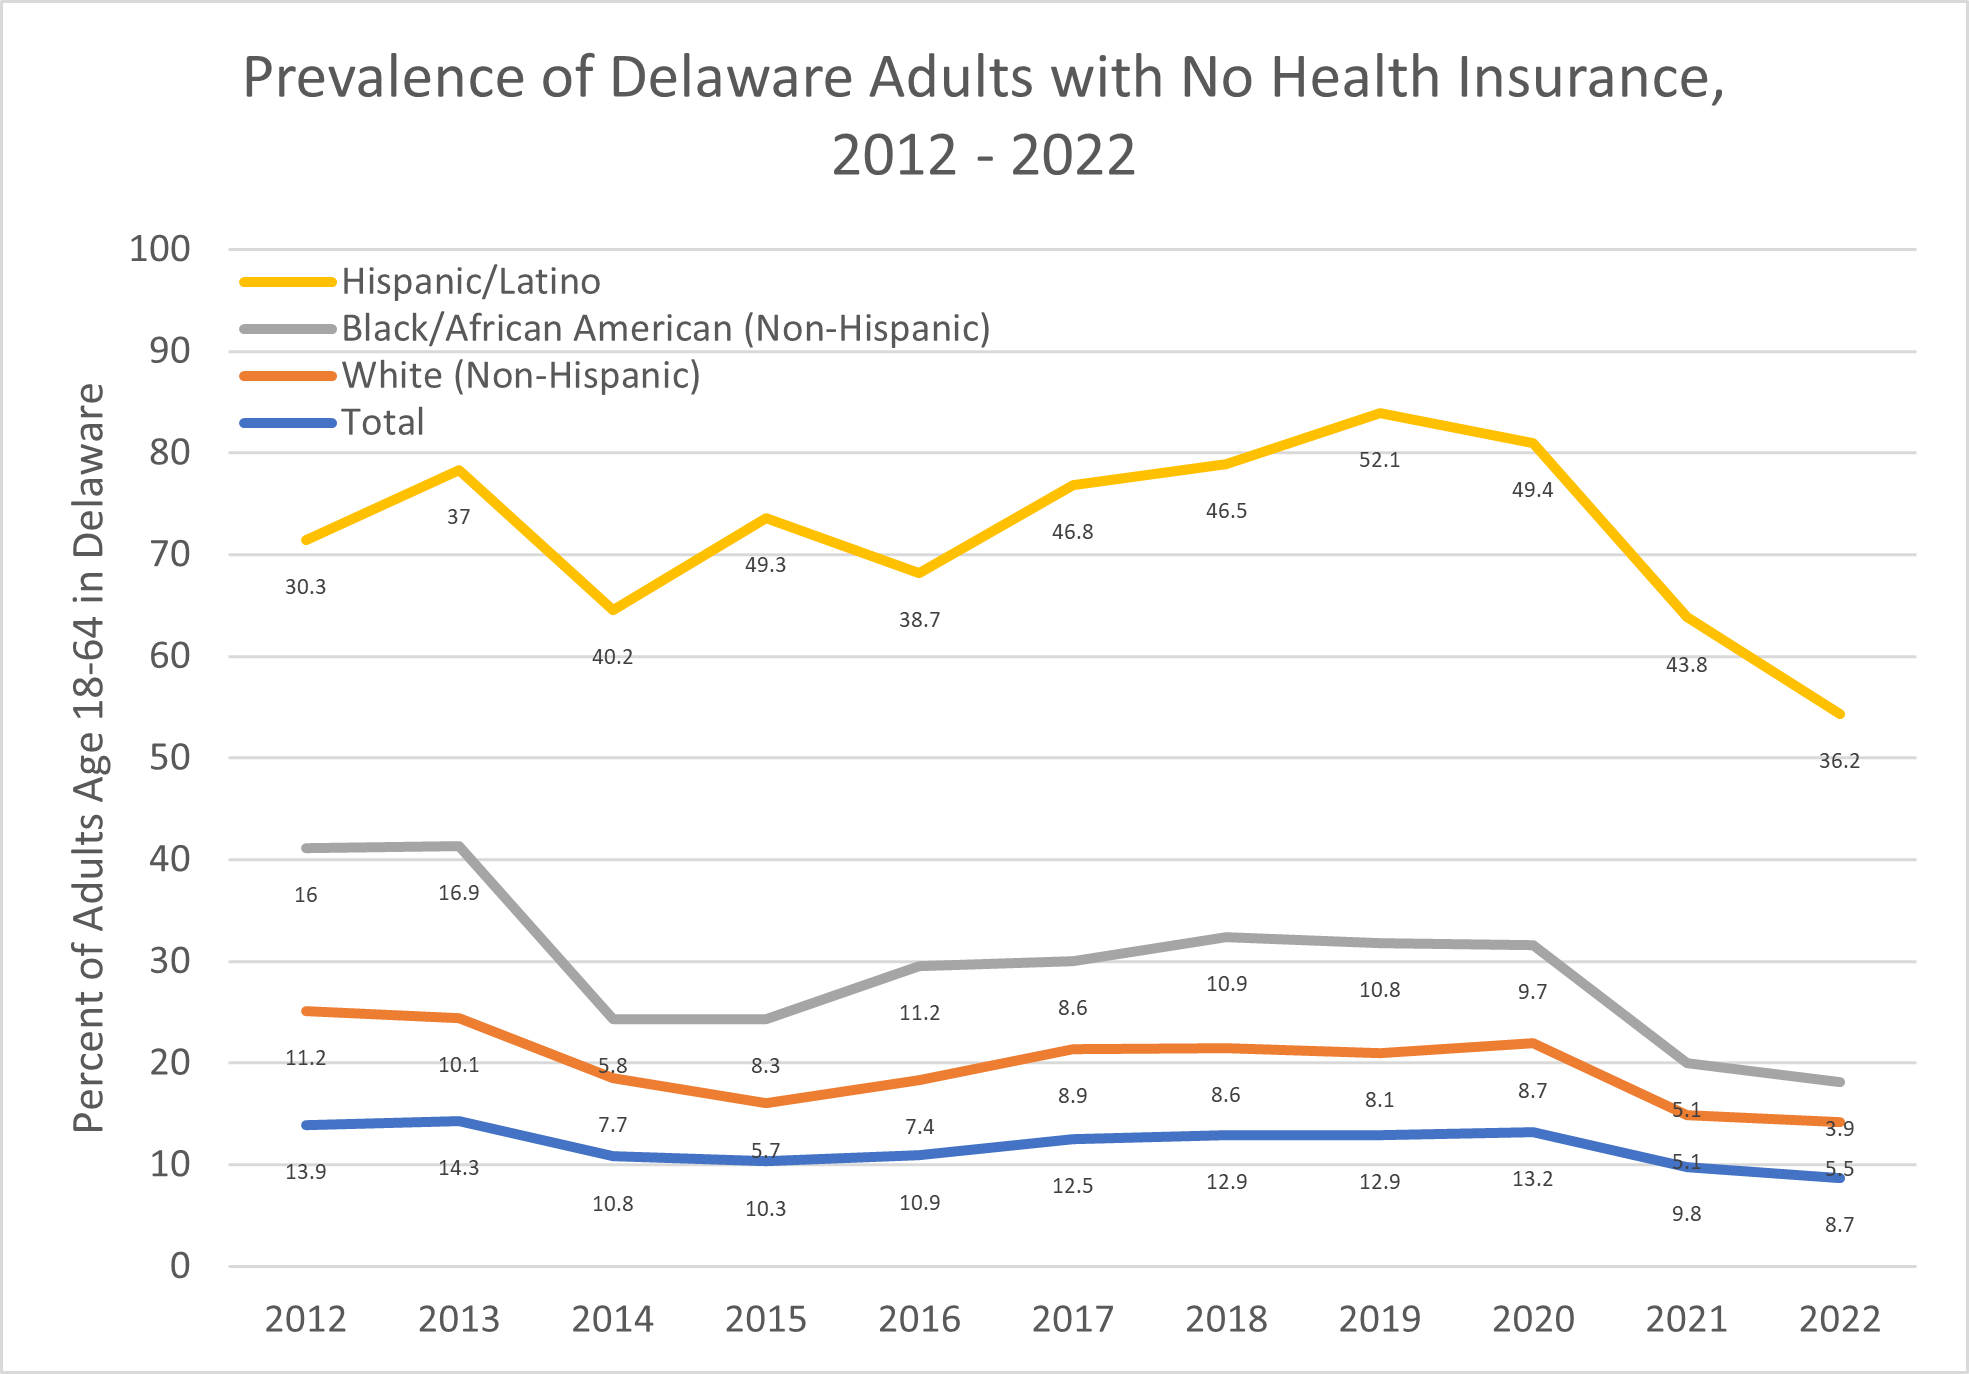
Source: Delaware Health & Social Services, Division of Public Health, Behavioral Risk Factor Survey (BRFS), 2012-2022.
Although the ACA was passed by Congress in 2010, its major features, like selling insurance plans through the ACA Marketplace, didn’t become effective until January of 2014. The graph above looks at the prevalence of uninsured adults for two years (2012-2013) prior to the introduction of the Marketplace, and then shows prevalence for the four years that the ACA Marketplace has been operational. In the first two years of the Marketplace, health insurance coverage in Delaware improved slightly overall as well as for non-Hispanic white adults; and it improved significantly for African American adults. In 2014, for example, the prevalence of “no health insurance” for African American adults dropped from 16.9 percent to 3.9 percent.
The state’s Hispanic population did not make any gains in health insurance coverage following the implementation of the ACA Marketplace. The prevalence of uninsured Hispanic adults increased from the implementation of the ACA in 2014 (when it was 37.1 percent) to 36.2 percent in 2022. The BRFS does not ask respondents if they are U.S. citizens.
Uninsured Adults by County
| Geography | Statewide | New Castle Co. | Kent County | Sussex Co. |
|---|---|---|---|---|
| Adults 18-64 | 8.7% | 7.3% | 6.6% | 11.1%* |
| (CI = 7.1-10.2%) | (CI = 5.1-9.5%) | (CI = 4.1-9.0%) | (CI = 11.1-17.3%) |
Source: Delaware Health & Social Services, Division of Public Health, Behavioral Risk Factor Survey (BRFS), 2022.
Primary Source of Insurance
In 2022, the BRFS asked about the primary source of health insurance for respondents:
- 41.0 percent had a plan purchased through their employer or union;
- 9.3 percent were covered by a plan they had purchased, or that was purchased by a family member;
- 38.5 percent were covered by Medicare, Medicaid, Medigap, Indian Health Service or another State program;
- 4.7 percent were covered by the military, TRICARE, or the Veteran’s Administration
In 2022, 78.7 percent of adults 65 and older said they were getting their health insurance through Medicare.
Personal Doctor & Other Findings
In 2022, 86.0 percent of Delaware adults said they had one or more doctors or health care providers that they “think of as their personal doctor.” Women had a higher prevalence of having a personal doctor than men. There is no statistically significant difference between Non-Hispanic White and Non-Hispanic Black adults on this question. However, as with health insurance, significantly fewer Hispanic adults report having a personal doctor.
Respondents were asked, “About how long has it been since you last visited a doctor for a routine checkup?” The question notes that an exam for a specific injury or illness is not included. Most respondents (78.8 percent) have had a routine checkup in the past year, and another 10.1 percent said they had a routine checkup in the past two years.
About 8.1 percent of Delaware adults respondents (representing about 65,600 Delaware adults) said there was a time during the past year when they needed to see a doctor, but could not because of cost. The majority of these respondents (95.6 percent) had health insurance, but may have been underinsured or had high deductibles. Almost a third, however, were adults without health insurance.
In 2017, the last time asked, the BRFS also asked if respondents have delayed getting needed medical care during the past year; and, if so, what – other than cost – was the most important reason. Only 18.2 percent said they had to delay medical care; and the two most frequent responses were: 7.7 percent of Delaware adults cited transportation issues; and 5.5 percent said they could not get an appointment soon enough.
Among adults without health insurance in 2017, 16.7 percent said it had been more than a year since they had coverage, and 25.2 percent said more than three years. Another 20.6 percent reported that they have never had health insurance.
Not including over-the-counter medications, most respondents (79.3 percent) said that there had been at least one time in the past year when they did not take medicine as prescribed because of cost. Another 11 percent of adults said they could not take prescribed medicine because of cost one or more times a month during the past year.
Satisfaction
Overall in 2017, 20.5 percent of Delaware adults said they are “very satisfied” with the health care they received during the year, and another 76.9 percent said they were “somewhat satisfied” with their health care. Only 2.6 percent said they were unsatisfied.