What Is the Meaning
of "Statistical Significance"?
of "Statistical Significance"?
Current Suspected Overdose Deaths in Delaware for 2025: Get Help Now!
Find school water testing results and additional resources
Attention Medicaid Participants: Eligibility Renewals Restarted April 1, 2023
The Delaware Behavioral Risk Factor Survey is a scientifically rigorous telephone survey of residents age 18 and older, with an annual sample size of about 4,000. Responses are used to calculate a statewide prevalence for a variety of health risk behaviors and conditions. However, different Delaware residents respond to the survey each year. As a result of this change in respondents, the estimated prevalence of a particular risk factor or behavior varies a little from year to year without any change in the actual prevalence.

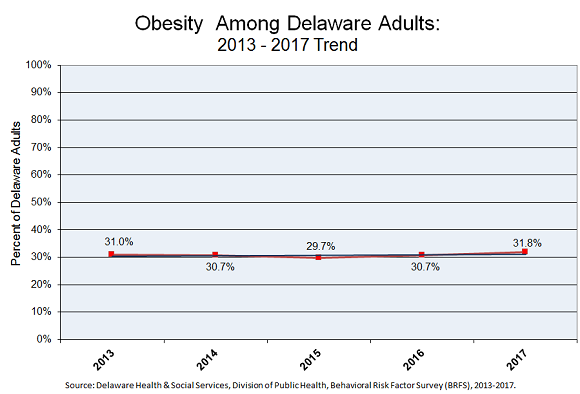
The graph above illustrates how prevalence estimates can vary from year to year, without the difference being statistically significant. There was no actual change in prevalence between 2013 and 2017.
Each prevalence estimate has a “confidence interval” – a range in which you can be 95 percent confident the actual prevalence falls. As long as the confidence intervals overlap, survey researchers feel confident there has been no change or difference in prevalence. A “95 percent confidence level” means that if the survey were conducted 100 times, 95 of the surveys would report responses within the same confidence intervals.
If the confidence intervals do not overlap, there likely has been a real change, and we refer to that as a “statistically significant” difference. If we see statistically significant differences, or if we see a steady trend upward or downward over a period of several years, we can say with some confidence that the prevalence is changing.
For example, if a prevalence goes up by only 1 percentage point – and that is well within the confidence interval – we cannot say there has been any increase or change. In that situation, the prevalence is statistically unchanged.
The chart below, showing the prevalence of adult Delawareans who are overweight but not obese, demonstrates a difference between New Castle and Sussex counties which is not statistically significant, because the confidence intervals (CI) overlap.
| New Castle County | Sussex County | |
| Overweight Adults |
37.6% CI = 34.3 - 40.9%) |
38.8% CI = 34.9 - 42.7%) |
Prevalence: the percentage of a population that is affected with a particular disease, condition or behavior at a given time, in this case a calendar year. Prevalence should not be confused with “incidence,” which refers to the occurrence of new cases. Incidence relates to the risk of contracting a disease, whereas prevalence indicates how widespread the disease or condition is in a population.
95 percent confidence level: When a survey is conducted at the 95 percent confidence level, there is a very high level of confidence that the results are valid. If the survey were conducted 100 times, 95 of the surveys’ responses would lie within the same range.
Confidence interval: the range of estimates within which the actual prevalence can be found. For example, the 2017 prevalence for adult cigarette smoking was 17 percent. The confidence interval, the range within which that estimate lies, was 15.3 percent to 18.7 percent.
Statistical significance: the likelihood that a relationship between two prevalence variables is caused by something other than chance. There are several tests for statistical significance. At the most basic level, if confidence intervals do not overlap the difference is likely “statistically significant.” Other analyses can be done if necessary – or, for example, to check for significance when age-adjusting data.