Current Suspected Overdose Deaths in Delaware for 2025: Get Help Now!
Find school water testing results and additional resources
Attention Medicaid Participants: Eligibility Renewals Restarted April 1, 2023
Delaware Behavioral Risk Factor Survey (BRFS) data were aggregated from calendar years 2006 and 2007 to provide a sample for the City of Wilmington large enough to be valid. The BRFS is a random-sample telephone survey conducted throughout the year, and data are normally reported on a calendar-year basis. County estimates may vary from annual prevalence estimates because of the two-year aggregation.
| Statewide | Wilmington | Suburban N.C. | Kent | Sussex |
|---|---|---|---|---|
| 12.6% | 12.3% | 11.0% | 13.3% | 15.8% |
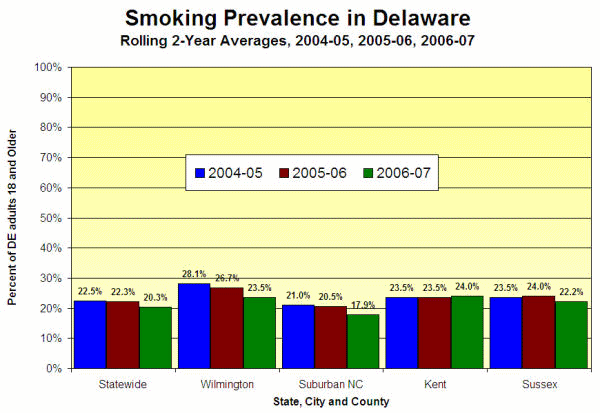
A comprehensive Tobacco Prevention and Control Program in the state has resulted in decreasing smoking prevalence; however smoking remains the number 1 underlying cause of premature death and illness in Delaware and the nation. The graph below shows the recent trends in smoking prevalence in Wilmington, suburban New Castle County, and Kent and Sussex counties. It is based on aggregated data and uses rolling averages. The chart that follows shows smoking prevalence by area for the aggregated years of 2006-2007.

| Statewide | Wilmington | Suburban NC | Kent | Sussex | |
|---|---|---|---|---|---|
| Smoke Every Day | 15.8% | 19.4% | 13.7% | 18.0% | 18.3% |
| Smoke Some Days | 4.5% | 4.1% | 4.3% | 6.0% | 3.9% |
| Former Smoker | 26.6% | 22.1% | 25.7% | 25.5% | 31.2% |
| Statewide | Wilmington | Suburban N.C. | Kent | Sussex |
|---|---|---|---|---|
| 21.8% | 24.1% | 19.6% | 25.1% | 23.7% |
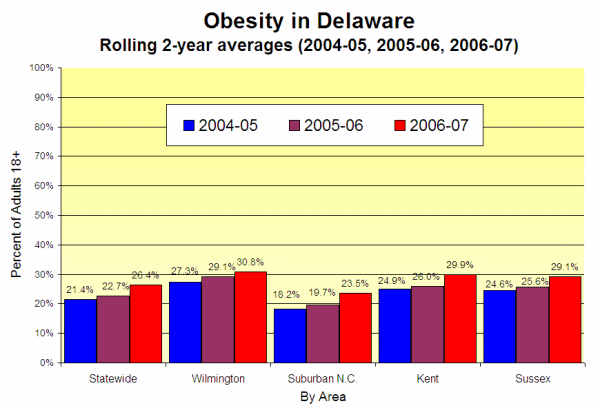
Weight is measured by Body Mass Index (BMI), determined from self-reported height and weight. Estimates are conservative; actual levels of overweight and obesity may be as much as 3 – 5 percentage points higher. Overweight is defined as a BMI between 25 and 29.9; obesity is a BMI >30. The graph below shows the recent trends, based on aggregated data and using rolling averages:

| Statewide | Wilmington | Suburban NC | Kent | Sussex | |
|---|---|---|---|---|---|
| Overweight | 36.3% | 32.6% | 37.2% | 34.1% | 36.9% |
| Obese | 26.4% | 30.8% | 23.5% | 29.9% | 29.1% |
| Statewide | Wilmington | Suburban N.C. | Kent | Sussex |
|---|---|---|---|---|
| 18.5% | 23.6% | 19.2% | 16.6% | 16.7% |
| Statewide | Wilmington | Suburban N.C. | Kent | Sussex |
|---|---|---|---|---|
| 8.7% | 13.8% | 7.7% | 9.3% | 9.2% |
| Statewide | Wilmington | Suburban N.C. | Kent | Sussex |
|---|---|---|---|---|
| 69.8% | 63.4% | 70.1% | 71.2% | 70.2% |
| Statewide | Wilmington | Suburban N.C. | Kent | Sussex |
|---|---|---|---|---|
| 67.4% | 66.8% | 66.0% | 67.4% | 70.0% |
| Statewide | Wilmington | Suburban N.C. | Kent | Sussex |
|---|---|---|---|---|
| 44.5% | 52.0% | 42.4% | 49.8% | 43.1% |
Source for all data: Delaware Health and Social Services, Division of Public Health, Behavioral Risk Factor Survey (BRFS), 2006-07.