Delaware Behavioral Risk Factor Survey (BRFS) data were aggregated from calendar years 2005 and 2006 to provide a sample for the City of
Wilmington large enough to be valid. The BRFS is a random-sample telephone survey conducted throughout the year, and data are normally
reported on a calendar-year basis. County estimates may vary from annual prevalence estimates because of the two-year aggregation.
Overall Quality of Health: Respondents Who Report "Fair or Poor" Health Status
|
Statewide
|
Wilmington
|
Suburban N.C.
|
Kent
|
Sussex
|
|
12.9%
|
14.4%
|
11.3%
|
14.1%
|
15.4%
|
Adult Smoking Prevalence
|
|
Statewide
|
Wilmington
|
Suburban NC
|
Kent
|
Sussex
|
|
Smoke Every Day
|
17.0%
|
18.1%
|
15.5%
|
18.1%
|
19.3%
|
|
Smoke Some Days
|
5.3%
|
8.6%
|
5.0%
|
5.4%
|
4.7%
|
|
Former Smoker
|
26.5%
|
21.0%
|
26.6%
|
25.1%
|
29.4%
|
Adults With No Leisure Time Physical Activity
|
Statewide
|
Wilmington
|
Suburban N.C.
|
Kent
|
Sussex
|
|
22.1%
|
27.3%
|
19.7%
|
25.1%
|
24.3%
|
Weight
Weight is measured by Body Mass Index (BMI), determined from self-reported height and weight. Estimates are conservative; actual levels
of overweight and obesity may be as much as 3–5 percentage points higher. Overweight is defined as a BMI between 25 and 29.9;
obesity is a BMI >30.

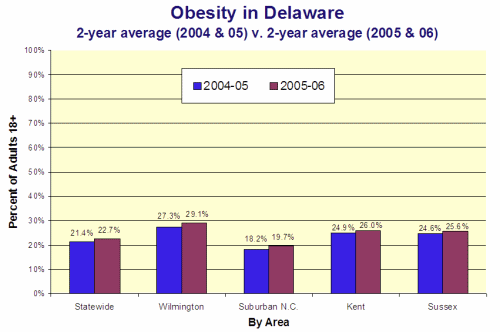
Adult Overweight and Obesity
|
|
Statewide
|
Wilmington
|
Suburban NC
|
Kent
|
Sussex
|
|
Overweight
|
37.3%
|
37.9%
|
37.3%
|
35.0%
|
38.6%
|
|
Obese
|
22.7%
|
29.1%
|
19.7%
|
26.0%
|
25.6%
|
Acute or "Binge" Drinking [5+ Drinks at One Occasion]
|
Statewide
|
Wilmington
|
Suburban N.C.
|
Kent
|
Sussex
|
|
17.2%
|
18.7%
|
18.5%
|
14.7%
|
15.4%
|
Current Asthma Among Adults
|
Statewide
|
Wilmington
|
Suburban N.C.
|
Kent
|
Sussex
|
|
9.3%
|
12.8%
|
9.0%
|
9.3%
|
9.1%
|
Flu Shots [Adults 65 and Older Who Received Flu Shot in Past Year]
|
Statewide
|
Wilmington
|
Suburban N.C.
|
Kent
|
Sussex
|
|
66.0%
|
61.9%
|
67.8%
|
67.3%
|
63.4%
|
Colorectal Cancer Screening [Age 50+ Who Ever Had Colonoscopy or Sigmoidoscopy]
|
Statewide
|
Wilmington
|
Suburban N.C.
|
Kent
|
Sussex
|
|
65.9%
|
66.8%
|
65.4%
|
65.3%
|
66.9%
|
Respondents < Age 65 Who Have Ever Had an AIDS Test
|
Statewide
|
Wilmington
|
Suburban N.C.
|
Kent
|
Sussex
|
|
45.5%
|
55.9%
|
42.9%
|
50.6%
|
44.7%
|
